

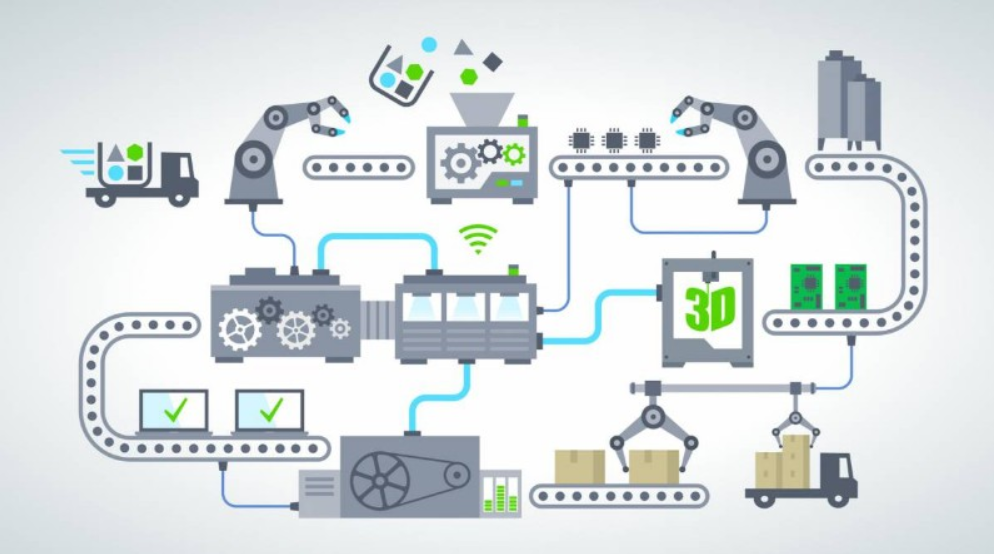
The systemic approach that enables automation systems to move to the next stage can be described as the Smart Factory.
It can be described as a set of systemic approaches from manufacturing to social business network, from integrated product development to data-driven control, from supply chain management to digital factory logistics, from cloud services to factory design in a digital environment.
Some of the activities that can be exemplified are;
With the developing technology, with newer visual applications in all fields, applications that tell everyone the same thing and aim to make correct determinations without being stuck in a person’s perspective have started to take place in the market.
Visual Factory simply means making factory data easy to understand and always traceable. ANDON screens, management monitoring screens and mobile applications facilitate the follow-up of work in this area, and solve the problem without spreading during the problem. Automatic bottleneck detection is one of these. In addition to these benefits, it makes a great contribution to the optimization of production processes. Visual management realized with Visual Factory applications makes anomalies visible and aims to create a “talking factory” by ensuring the whole team understand at first glance.
In short, the Visual Factory consists of the whole of the new generation MES applications in which the factory talks to the user thanks to the software and hardware.
As the of emergency entire team is informed situations with increasing communication, it also enables emergency intervention about work safety.
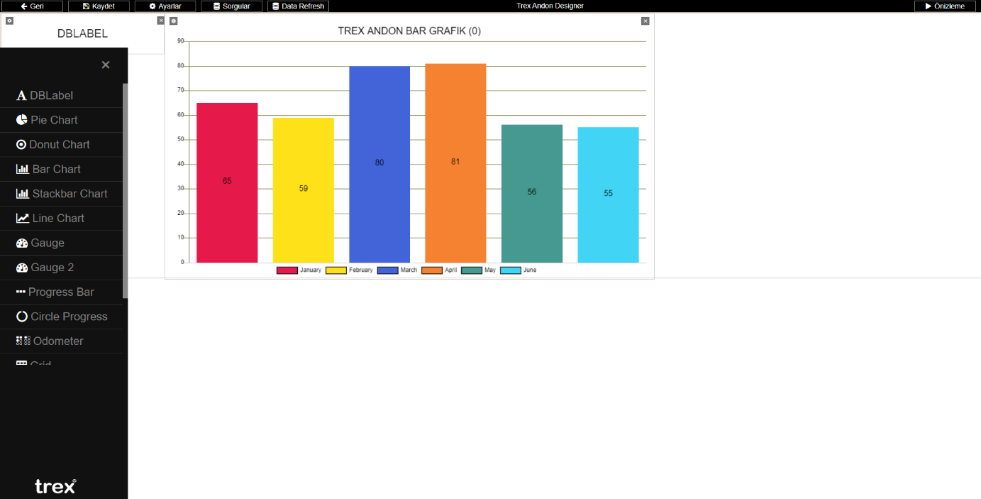
First of all, we need to communicate with machines. We can do this with I / O cards as well as with the OPC protocol at the highest level. Then, various dashboards, reporting tools and their mobile versions can be used to visualize the data obtained and the analysis made from that data. It is important to design the screens that we call ANDON in factories.
In the menu on the left, there are visual tools you want to see on the Android. Chart types, gauge, progress bar etc. SQL queries are created from the queries section for the data you will use in the visuals. Afterwards, you can visualize that query from the settings section on the upper left of the bar chart on the screen by connecting it to this chart and make other settings.
With the reporting modules, the users can create reports as they wish.
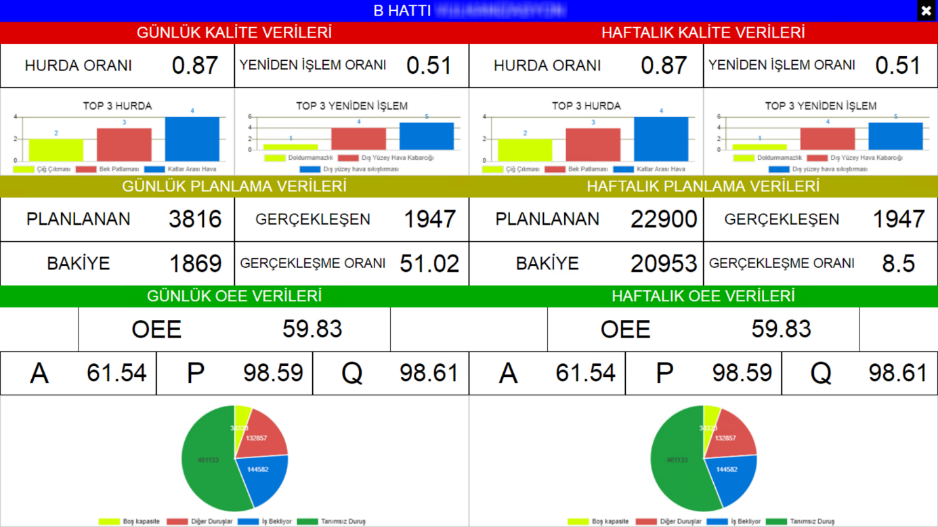
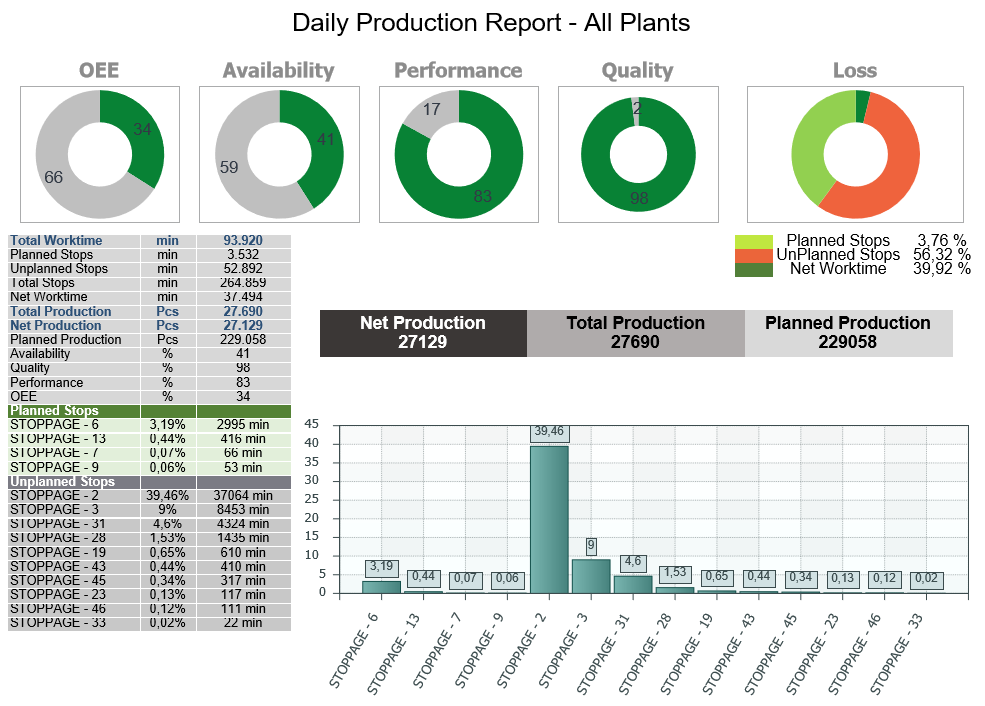
In addition, the visualizations of your analysis can be as follows. The factory’s OEE can be monitored as business center, Workstation, line basis for annually, 3 months and 6 months periods . Separate graphs of the components of A, P and Q OEE analysis can also be displayed.

On the mobile side, sample applications are as follows;
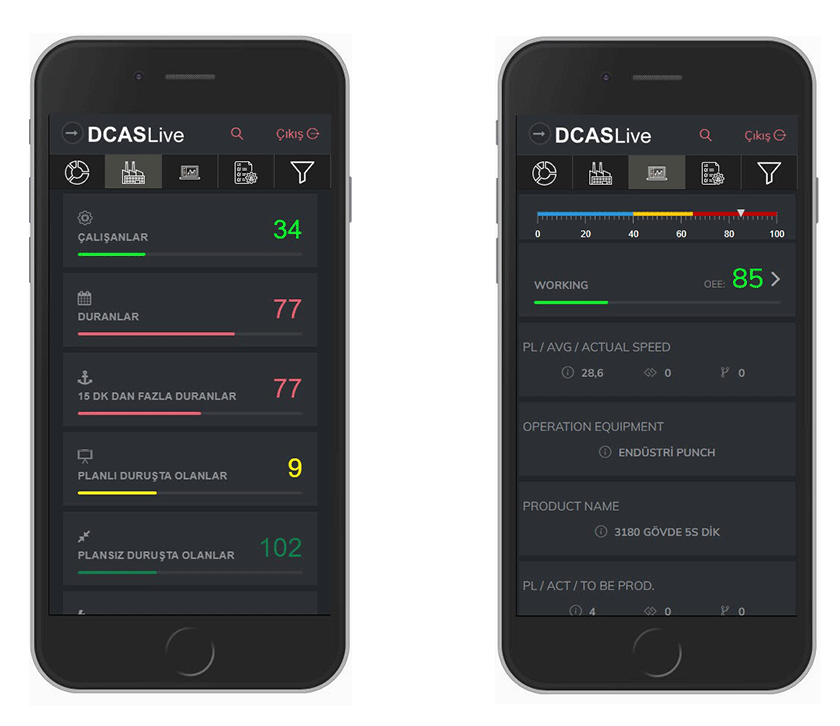
In this way, you can follow every moment of production from anywhere. It can be followed both on the mobile, on the web and the andones placed in the factory and reports can be created as desired.
The focal points of smart factories using MES are; data, action, situation and learning.
Data: The parameters (tension, temperature, cycle, pressure, energy consumption) of the tools (machine, robot, human, tool) used in production should be instantly accessible, and the process data should be kept in a statistical database.
Action: Systems that make decisions or make suggestions by performing data analytics of process data and output data should be established. For example, the production plan should be optimized according to the use of energy-consuming production tools (paint machine, drying) at low energy hours. In another example, systems that minimize set-up times should be installed while switching from product to product.
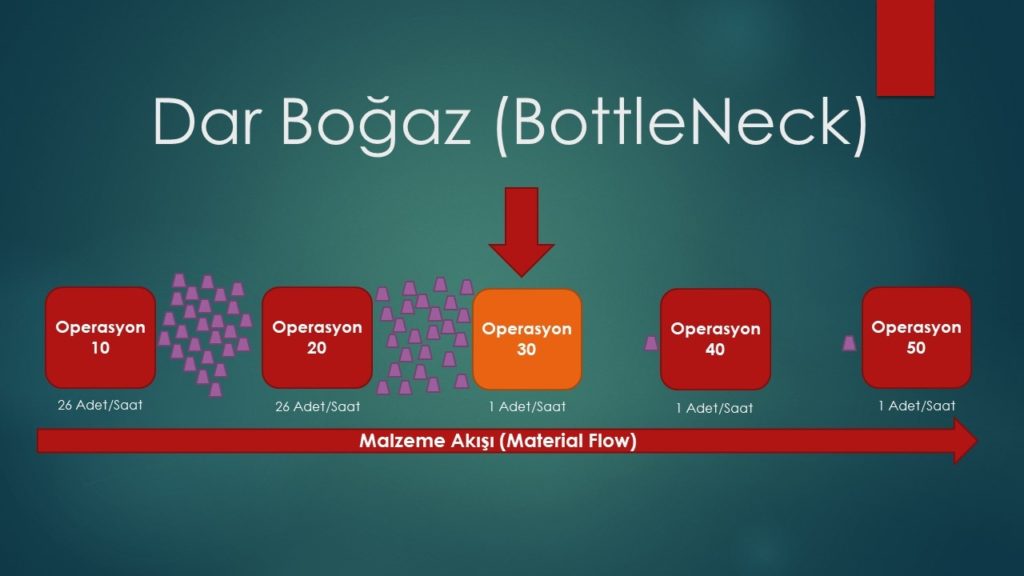
Situation: Push notifications and alerts, self-adjustment of machines in case of work orders, breakdowns, scraps and direction of various KPIs, bottleneck detection in line-based businesses can be mentioned. It is important that current stuations can be followed online.
Learning: Forecasting systems should be established by creating models with production data. Breakdown predictions should be made with the data collected from the sensors on the machines and the production plan should be arranged accordingly.
The bottleneck is a situation where the entire work flow slows down at some point in production and causes slowdown in subsequent operations. After determining the root cause of the bottleneck where the slowdown is experienced, it is necessary to ease the work flow by improving the process or fixing the problems.
One of them is anomaly detection. Anomaly detection is essentially a classification problem. That is, separating the abnormal data from the normal data. By detecting anomalies on the sensor data on the machines, it can be observed whether the machines work properly or not. When an anomaly occurs in your machine, which you monitor through sensors while the operator is working, the incident can be intervened without breaking the machine.
Another is predictive maintenance. In order for the production to continue without interruption, our machines must never stop or break down. For this, it is important that their maintenance is done on time. Therefore, the estimation of maintenance time must be made correctly. Early maintenance increases the company’s maintenance costs. If the maintenance is done late, it causes the breakdown of the machine and cause production loss.
Making analyzes easier: An analysis can be made simply by making selections from only one interface, perhaps without writing any code.
Automating the data processing part: Before performing an analysis, that data must be pre-processed. For example, finding outliers, eliminating missing values in the data set.
Determining the analysis method more easily: When you consider a problem and try to determine its analysis method, this method may not be obvious. In fact, you may have to try a few methods and choose the one that gives the best results. Being able to do this easily means saving time.
The analysis made makes little or no false predictions: It must go through a learning phase while using deep learning and machine learning methods. During this learning phase, the model can make false predictions and this creates a financial liability. Developments in this area also reduce such costs.
First of all, companies that have just started working with us are discovering their real capacities and are very surprised to see how much they are actually working under their real capacity by instantly tracking their losses. Rather than calculations made on theoretical excel, we show the businesses where improvement will be made and directly improve them with the analysis we offer over real values with instant data.

The future is heading towards fully autonomous production with the development of artificial intelligence (AI) applications. For example, in the factories we have applied so far, it has ensured that the human workforce is used in the right place rather than the decrease. It will continue to be the same in autonomous systems in the future. Because as people’s need for body strength decreases, they will continue to exist at more efficient points in mentally production. We have been experiencing a huge transform. In the near future, we will encounter systems where appropriate solutions are produced by simulating production processes. With less energy, less time, less raw material and less carbon emission, we are in a period in which benefits will be experienced even when transforming in many areas.
![]()
![]()
We’ve blended our perceived value with the solutions we provide, while transforming our customers to our solution partners, and are working tirelessly to bring our services to every point of the globe.