
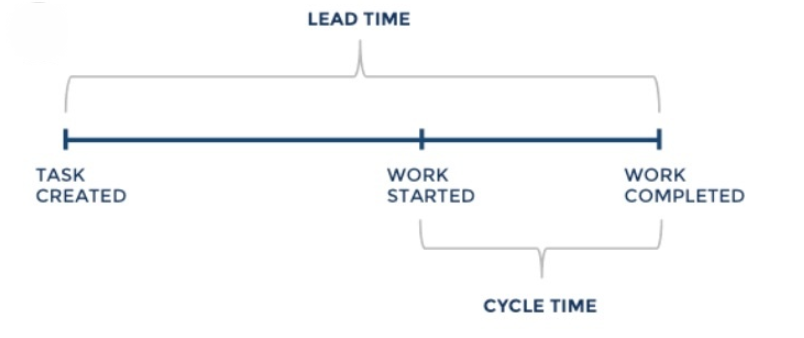
Cycle time is one of the most important data that can be obtained from the production site. Unfortunately, even if it looks very simple, mistakes are often made. These errors can also occur in the methodology, so they can also be in the values of the cycle time itself.
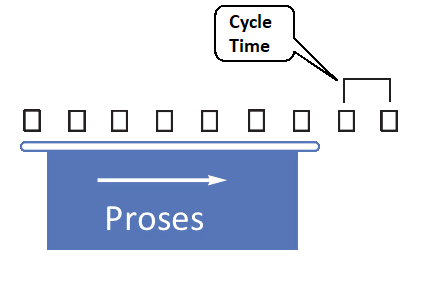
In the simplest form, the frequency of completing the product to be produced by a process is called cycle time. In other words, it can be called the time from the starting point of a product to the arrival of a new product to be processed at the same point. It is an easier process to understand and calculate for processes that come out as a single unit in each cycle. The cycle time will be 55 seconds for an operation that includes 10 seconds of binding, 40 seconds of processing and 5 seconds of unmounting on the CNC.
Of course, it is possible to calculate cycle time with a similar approach for cumulative productions. For example, if a dyeing furnace takes 20 parts per cycle for the product to be measured and it takes 60 minutes to complete this batch and pass to the next batch, the cycle time of a product will be 60 minutes / 20 pieces, consequently 3 minutes. The point to note here is that whether we are talking about a single unit or a batch, loading and unloading times should not be ignored.
In fact, the cycle time is the maximum time the product spends at the station. It would be more appropriate to divide this into sub-units for analysis and improvement. The definition that was first described is called full cycle time and at the most basic point can be divided into machine time and operator time. In the classical approach, the sum of these two gives the full cycle time. But in some processes, this math will not always work as operators can deal with other jobs in parallel during machine auto time.
In the case that an operator takes the edge burr of the nth product while machine printing the n + 1 product in plastic injection, the machine time + operator time will be longer than the full cycle time.
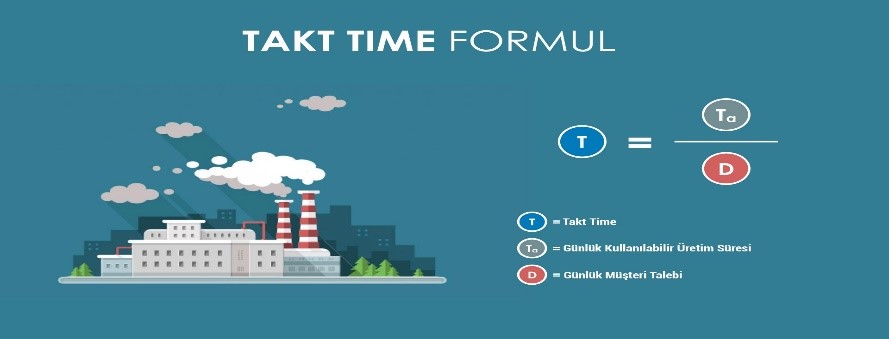
Another point to be mentioned when talking about the subcomponents of full cycle time is the definition of takt time; When the concept of cycle time is investigated, the concept of takt time is often encountered, and unfortunately, these two concepts are often confused by users in practice and are used interchangeably. Takt time depends on customer demand. The daily available production time is calculated as daily customer demand. This value is compared with the cycle time, and if the cycle time is more than takt time, it should be ensured that the customer demand can be met by optimizing the process or increasing the resource.
It is a common habit to use that equipment at the maximum level to get the maximum benefit from our equipment investments. But the problem arises that the equipment cannot handle more demands than it does the harm of idling. Even if the order is fulfilled, it is a predictable result that teams working hard to meet unreasonable demands will sacrifice quality.
Correct planning is the most important and first step to prevent such consequences. Correct cycle time is the basis for a correct planning. While maintaining a balance between reducing the cost of holding stock and increasing demand, it can be said that if we start with the cycle time we are not sure about, we simply leave it to chance.
“Good things only happen if you plan, bad things happen by themselves.”
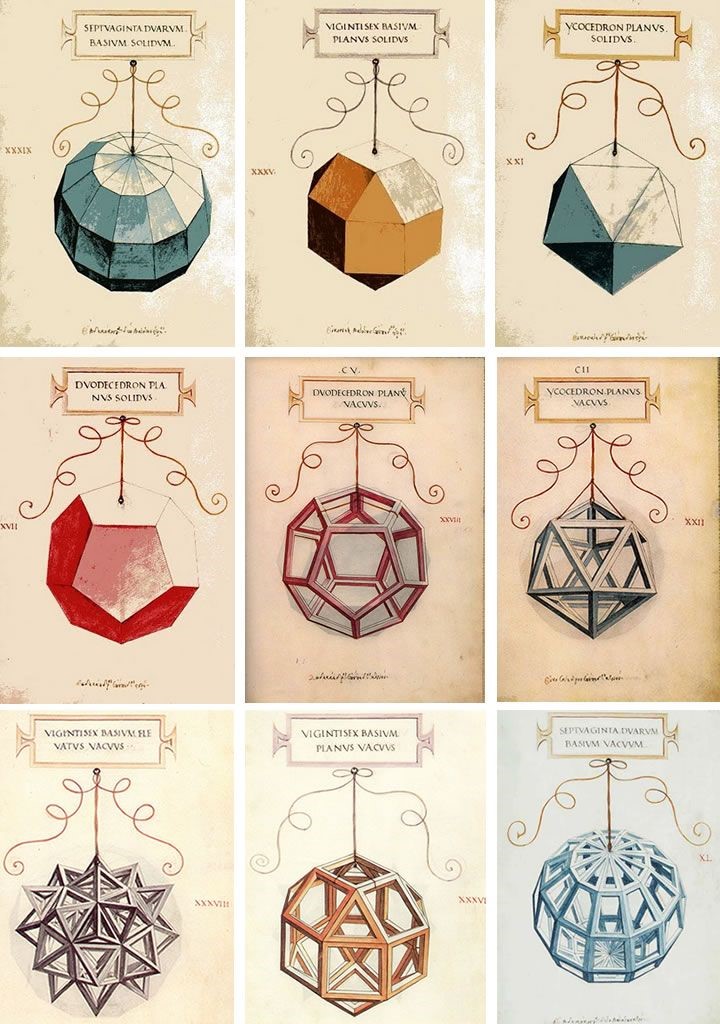
Until the 15th century, mathematical calculations could be calculated with the help of simple geometric figures. (Triangles, rectangles, circles, etc.)
The object to be measured was compared to these simple shapes and made with high error rate calculations. For example, after a river flooded, the boundaries of the fields next to the river were determined again. The operational errors made were negligible compared to the inability to measure at all and to completely lose the boundaries of the fields.
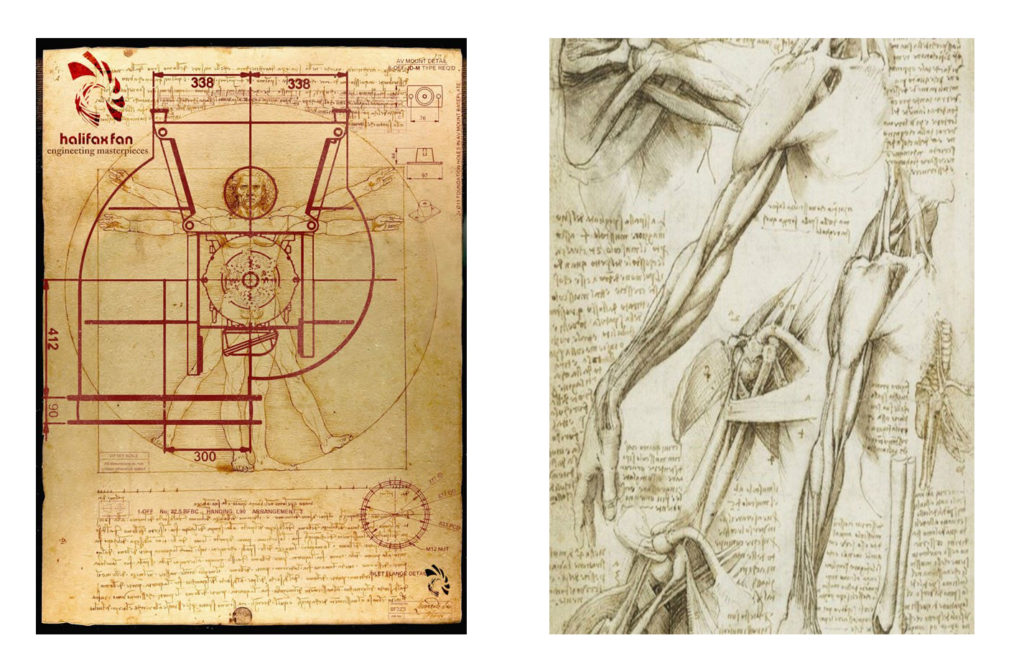
This famous sketch comes from a much older Roman architect named Vitruvius in 1492.
The tools used became insufficient to solve mechanical problems as the needs advanced. Error rates were very high in these calculations. In mechanical problems it was too much to be accepted.
Leonardo Da Vinci, one of the important engineers of the period who lived in the 15th century, worked in many fields, from machine design to architecture, anatomy.

He solved the problems that he cared about geometric shapes and wanted to solve the problems he encountered by using geometric shapes frequently.
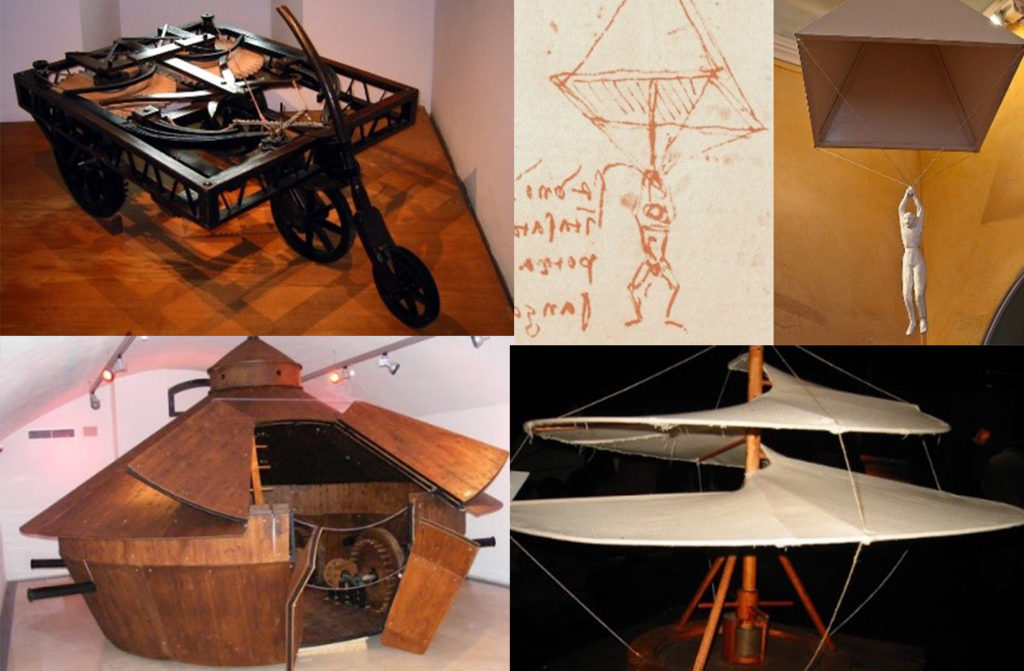
This simple geometry-based calculation was insufficient to calculate the mechanics of tools that do not have a standard shape, such as helicopters, three-barrel guns, automobiles, tanks, etc. and to produce those machines and assemblies.
Since there was no deepening in the disciplines of engineers and mathematicians in the 16th century, the distinction between engineers and mathematicians was not as clear as today. Stronger analysis methods were required for them to solve mechanical problems. In the production of steam machines and tools, this calculation with a margin of error became insufficient.
Mathematical calculation methods were developed. The new tool was obtained by derivative-integral, the most important of which was the smallest unit that can be found with DL, DS, DV and the calculations were made by adding them within the limits. It offered great opportunities to engineering and was a tool for development.
So, what are DL, DS, DVs that will enable you to analyse better in the production field? What are the smallest meaningful pieces you can find?
Your cycle times. Calculating cycle times only with data on paper in the office is like calculating before the 15th century. Large error rates are highly likely. The calculation on paper is generally the same as what is in production. While determining cycle times, the production department must be at the center of the business.
Data is taken in the production area – to ERP – to bill of material – to planning – back to production site with work order – measured again and the cycle is repeated.
Cycle time has subcomponents. Although full cycle time works for planning, analysis of this in sub-categories becomes even more important for improvement studies. If it is necessary to open sub-categories, the following titles will emerge;
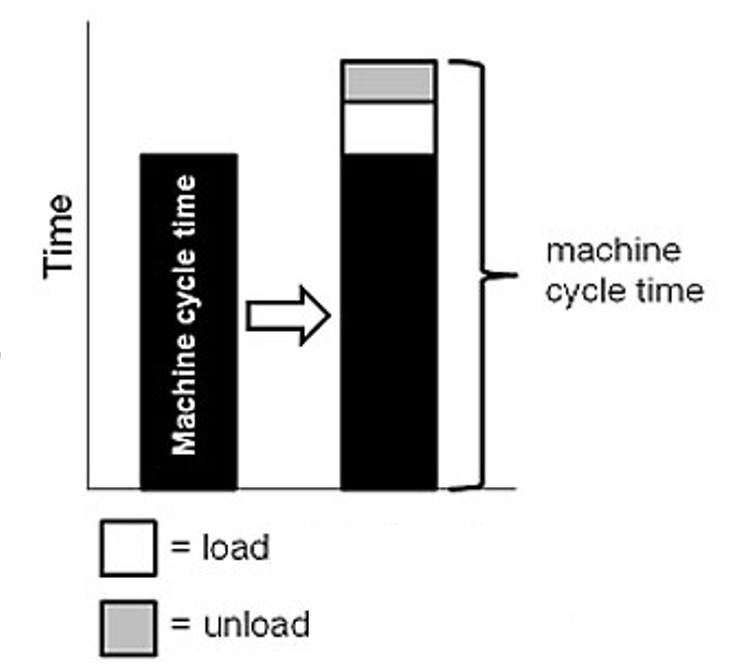
Effective Machine Cycle Time: Machine cycle time plus loading and unloading time, plus set-up time per unit. The value obtained here is the capacity volume for a product that must be reserved in the machine.
The known preparation time, namely the set-up time, is the time of making the work system ready to perform the task and, if necessary, restoring the system after the task is over. The difference from the load and unload time at the full cycle time is that it is usually done “once” for each order.
Machine Cycle Time: The time required for a machine to complete all operations on a part, in other words, the time in which the machine and the part are directly related in the cycle.
Operator Cycle Time: When timed by observation, it can be called the time required for an operator to complete all elements of the work at a workstation before starting to repeat it.
Before performing cycle time analysis in a process, that process must be standardized and defined. A point that is constantly underlined in the lean manufacturing approach is that; “It is not possible to measure or improve an undefined value without being measured.”
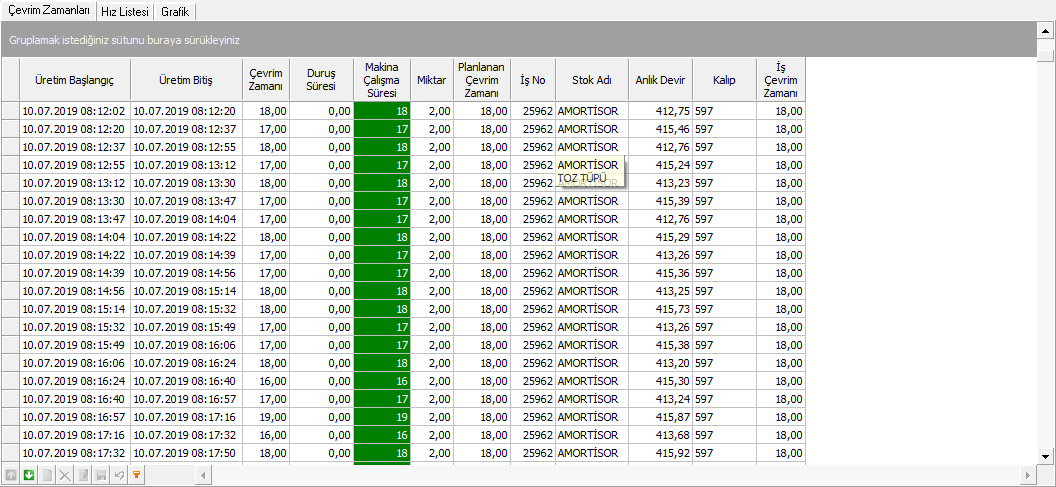
The most frequently used method in analysing the cycle time is the time determination study performed by directly measuring with a stopwatch in a selected time period.
In this case, as the sample number increases, the accuracy of the data increases. However, there are two problems that should not be ignored in measurements made with this method. The first is that being observed can mislead the perception created by the person who does the job. The second problem is that the limited time frame causes us to overlook the variables that depend on the circumstances.
Increasing the sample size decreases the margin of error for the second question, but in this case, the power of the measurement will increase considerably. Moreover, the variety of parts to be measured and frequent changes in physical conditions make it very difficult to perform this measurement for all production processes in some enterprises.
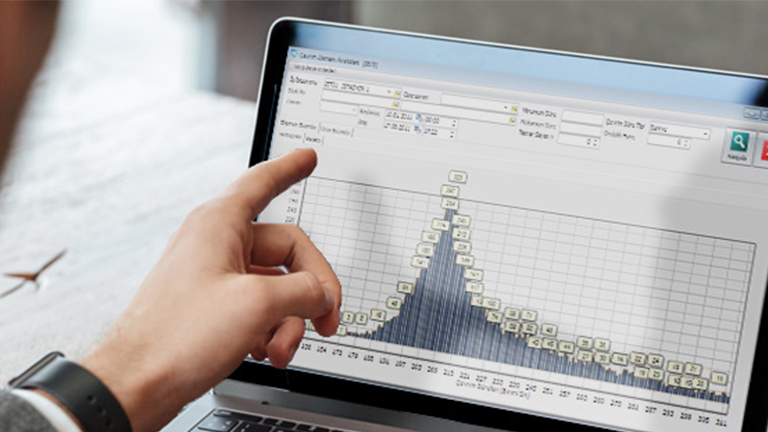
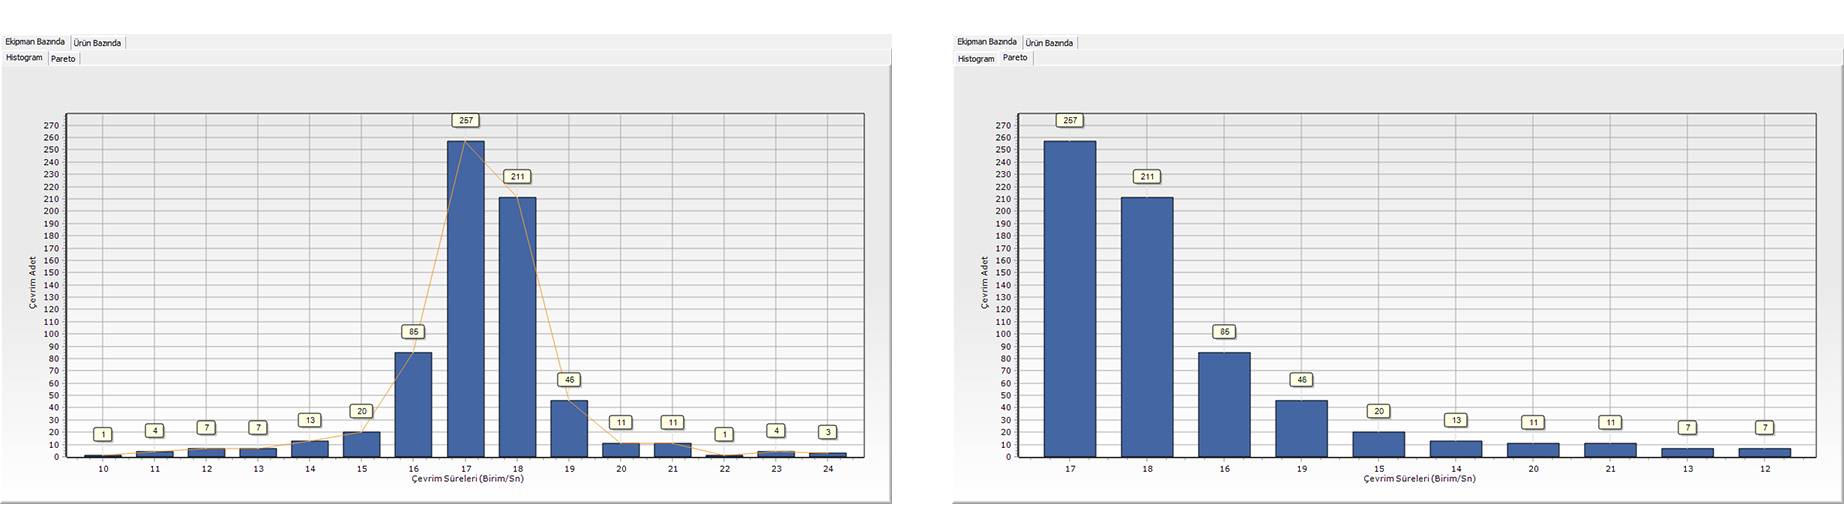
Since MES Systems instantly monitor the data of the equipment and keeps them under continuous recording, these analysis are made automatically by the system. The analysis indicated in the images have been prepared by the system.
Of course it can be improved. For those who want to correct the losses in their businesses during the set-up periods, there is a true treasure.
MES users can make improvements in their set-up times, since the start and end times of each set-up period are accurately recorded.
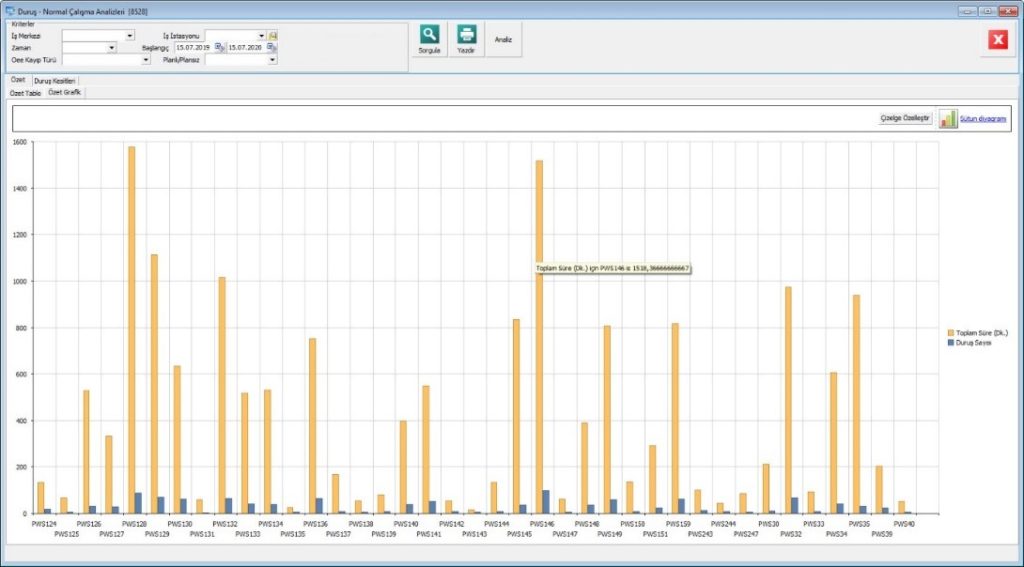
It is necessary to consider set-up as a process in itself.
It is necessary to take a lot of samples to determine the ideal set-up time. When a sufficient number of samples cannot be taken, ideal durations cannot be determined.
First of all, it is necessary to explain what is line balancing. Line balancing is to ensure high machine and workforce utilization by equalizing the speed of each work equipment.
The output obtained in the specified time unit is called speed. The speed mentioned in cars is actually the same thing. If the specified time unit is hourly, it is spoken about how many kilometres per hour it goes, this can easily be converted into cycle time. 1 minute, which is the time to travel 1 km of a vehicle traveling at 60 km / h, can be called cycle time.
While this point is so easy to turn to each other, the purpose of using the speed unit is;
It is especially suitable for preventing confusion in continuous production as it is referred to with the unit of speed. For example, if we say the ideal cycle time for cable production is 1 minute, it will not be clear whether it is for a meter, a km, or a reel. But when 120 mt / min is said, the same thing is understood by everyone. As the speed issue becomes clear, if we go back to the line balancing issue, it is done to equalize the speeds of the equipment, but this is quite simple in theory, but also difficult in practice. The action to be taken;
At this point, the stage of dividing the work into units sometimes cannot be kept at the desired level due to the nature of the process, and even bottlenecks begin to occur.
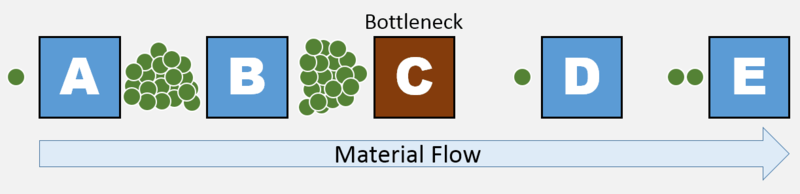
In the picture, station C is the bottleneck on this line.
These bottlenecks reduce the efficiency of previous and subsequent equipment, accumulated stocks cause poor quality production in some cases, increasing production flow time. In some cases, when a new product is commissioned, due to the structure of the equipment, so many stocks accumulate before the bottleneck that it is necessary to take them out of the line with a manual process and then feed them manually.
These are all processes that increase production costs but do not create value, that is, the customer is not willing to pay. The line balancing should not be regarded as a one-off job at the first installation stage. It may not work at the originally planned efficiency due to reasons such as increased model changes, new product commissioning. For this reason, if the efficiency is low, the line should be rebalanced by supporting it with continuous improvement i.e. kaizen applications.
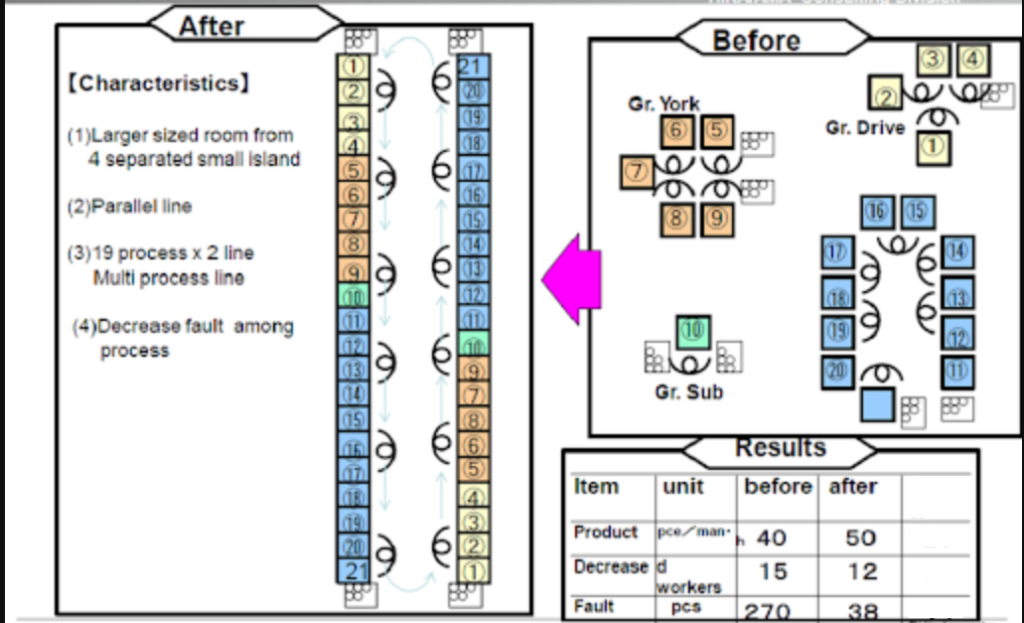
With this kaizen, the speed of the line has been increased from 40 pieces per hour to 50 pieces per hour.
Cycle time is needed directly for balancing. The more accurate the cycle time used in the initial calculation, the less the difference between planned efficiency and actual efficiency will be.
One of the most effective methods to measure the success of kaizen studies after commissioning of the line is to compare the previous and next cycle times.
Improving cycle times improves the performance parameter of OEE. Is it just performance? No.
When the process is standardized with a lean logic, the number of faulty production will decrease and your quality value will increase. The reasons that lead to downtime will be eliminated and your availability rate will increase. In other words, it improves the performance, quality and usability/availability parameters of OEE.
![]()
![]()
We’ve blended our perceived value with the solutions we provide, while transforming our customers to our solution partners, and are working tirelessly to bring our services to every point of the globe.